The Ten Kites Management Portal provides an overview of statistics relating to your Ten Kites account and associated brand units. You will see this page when you log in or by clicking the house icon from the toolbar on the left:
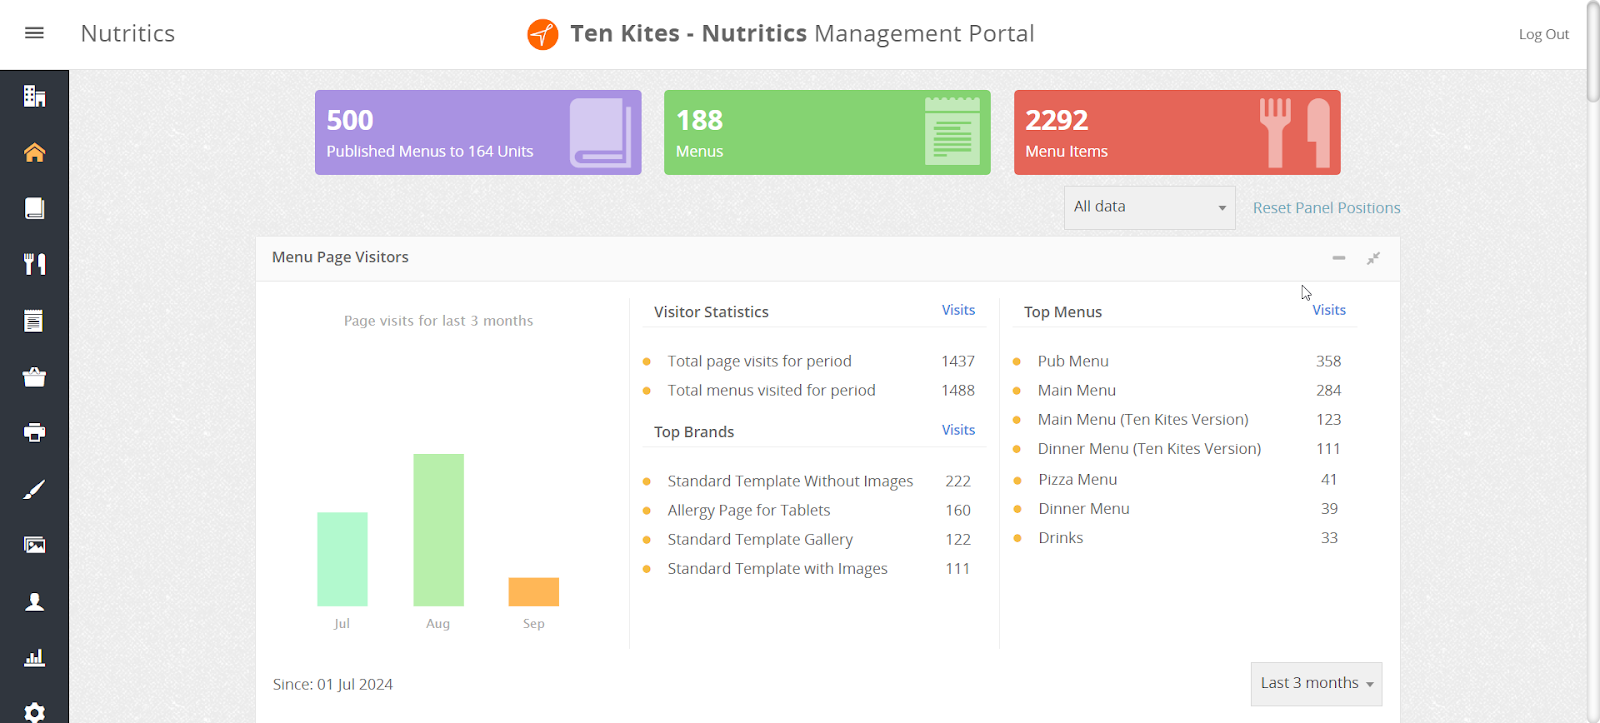
The buttons at the top of the page shows stats on:
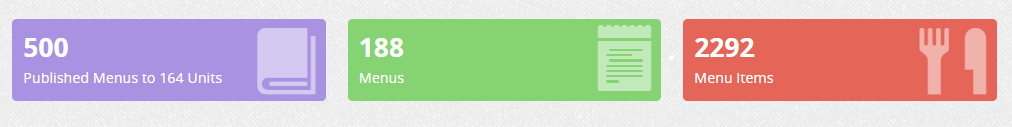
- Number of menus published and the number of units
- Numbers of menus on your account
- Number of menu items on your account
You can click the buttons to open the relevant page on Ten Kites.
Use the dropdown in the top right corner of the page to change the data being analysed e.g. guest menu page, digital cookbooks, digital signage pages etc.
All panels can be minimised or expanded using the buttons in the top right corner of each section:
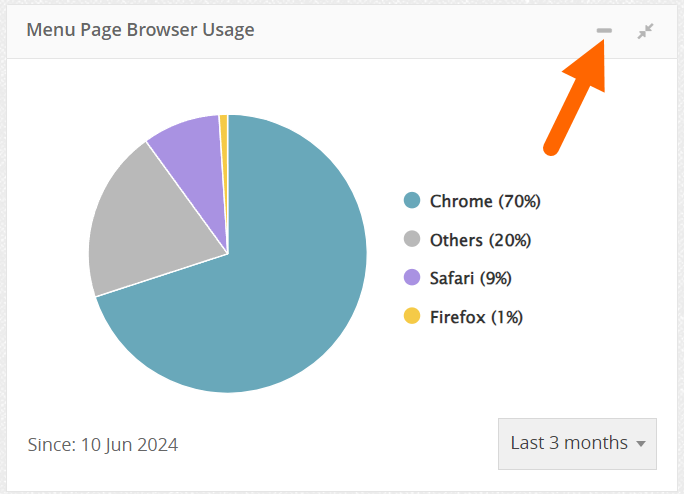
The dropdown in the bottom right corner of panels allows you to change the time period being analysed:

You can drag and drop panels around the page to reorganise the view. You can then reset this using the ‘Reset Panel Positions’ in the top right corner of the page.
Data available on this page includes:
- Menu Page Visitors – Includes page visits for the last 3 months, visitor statistics include total page visits, total menus visited, top brands visited and top menus visited.
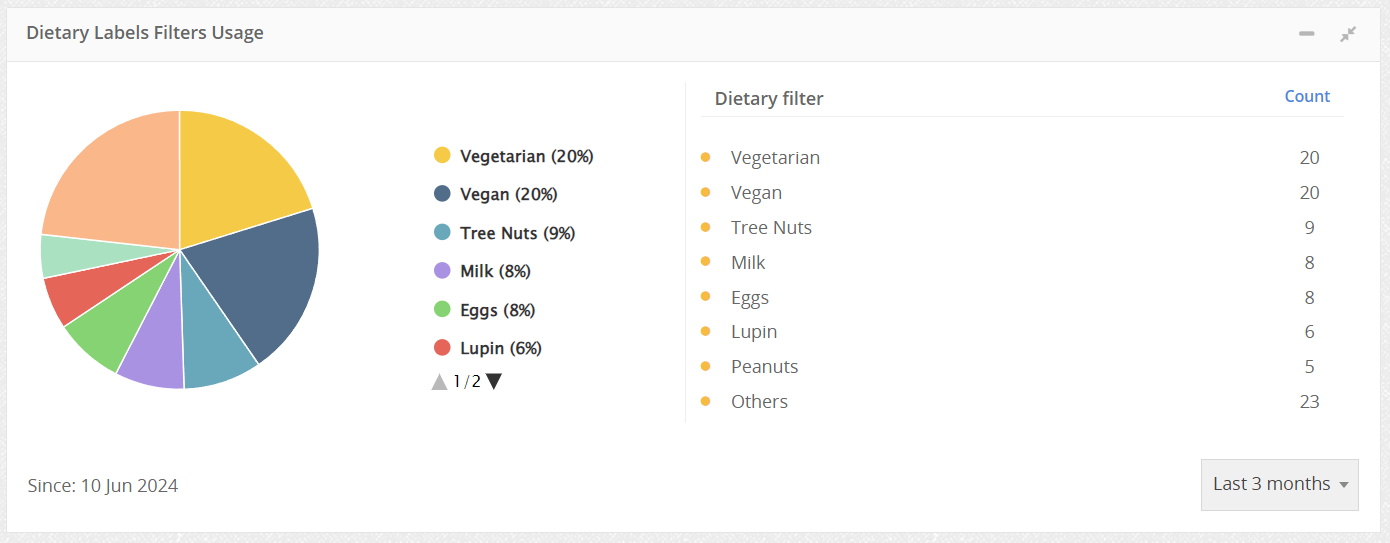
- Dietary Labels Filters Usage – A pie chart showing the most popular dietary filter being used to filter menus. View a usage count on the right:
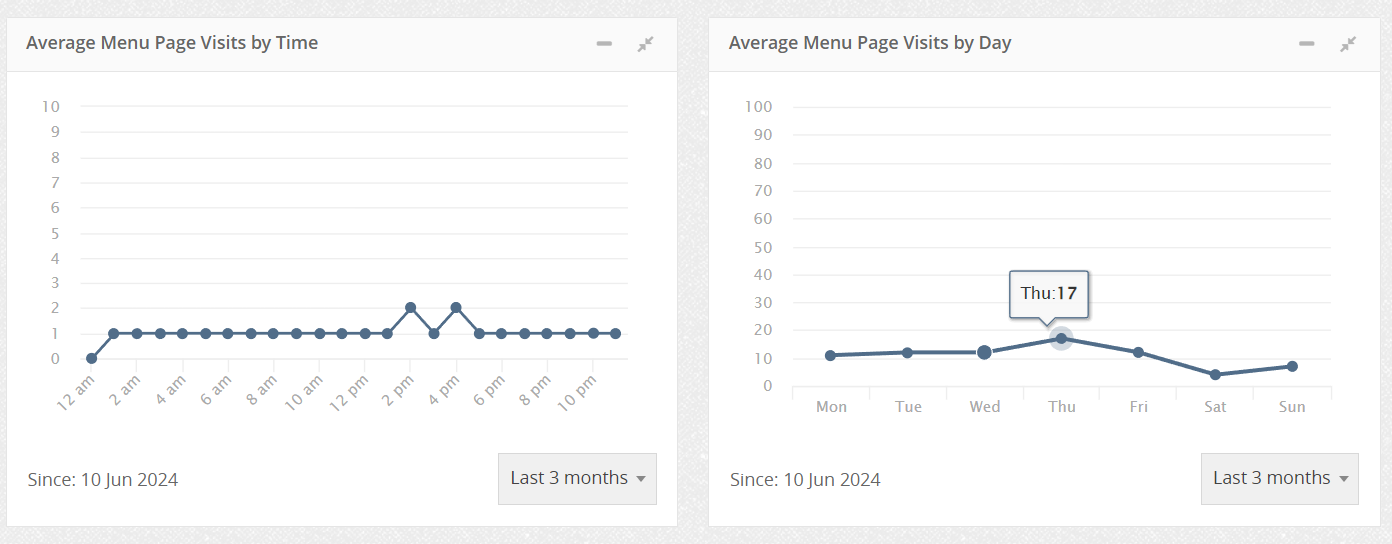
- Average Menu Page Visits by time – Line graph detailing the average menu visit count through the hours. Hover over the line graph to view visit counts also.
- Average Menu Page Visits by day – Line graph detailing the average menu visit count per day of the week. Hover over the line graph to view counts per day also.
- Menu Page Device Usage – View what device your guests are visiting your menus on e.g. Mobile, Tablet, Laptop.
- Menu Page Browser Usage – Pie chart detailing what browser your guests are visiting your menus on e.g. Google Chrome, Safari, Edge etc.
- Menu Page Visitors by City – Use the map to view what cities your guests are viewing from. This includes a visit count in the column on the right or you can hover over the city to see the count.
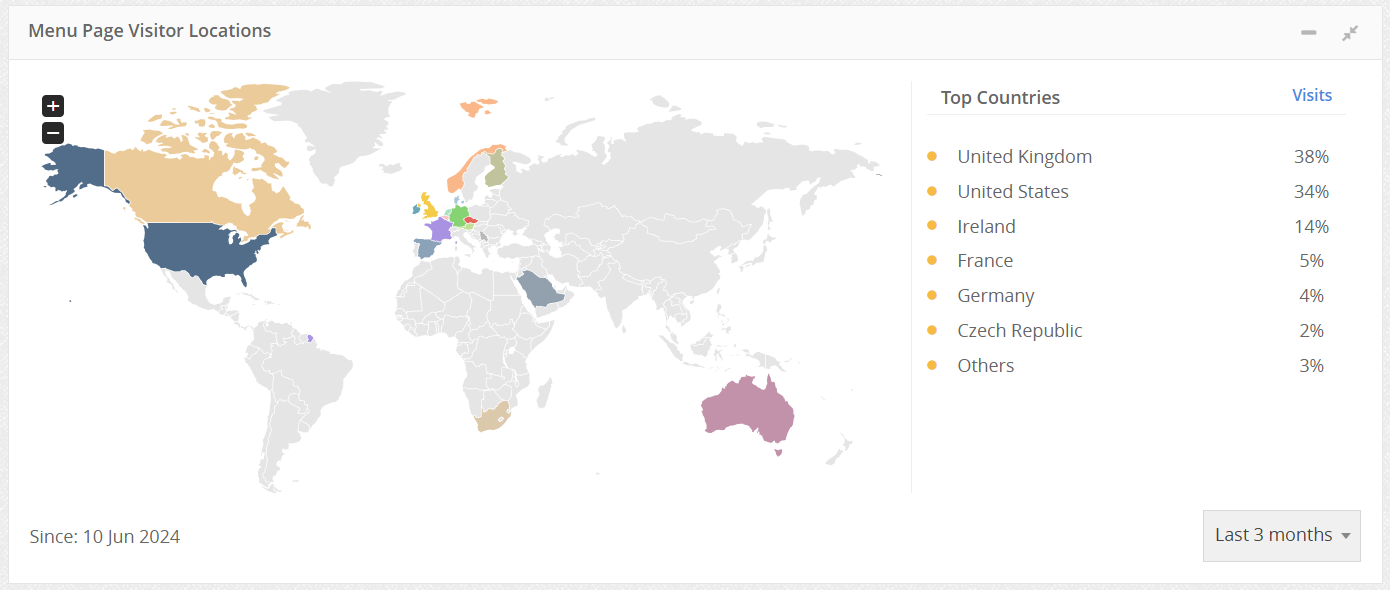
- Menu Page Visitor Locations – Use the map to view what countries your guests are viewing. This includes a visit count in the column on the right or you can hover over the country alternatively:
- PDF Download Statistics (for the last 6 months) – include a bar chart detailing PDF downloads per month, total PDF download count, top brands being downloaded, top menus being downloaded
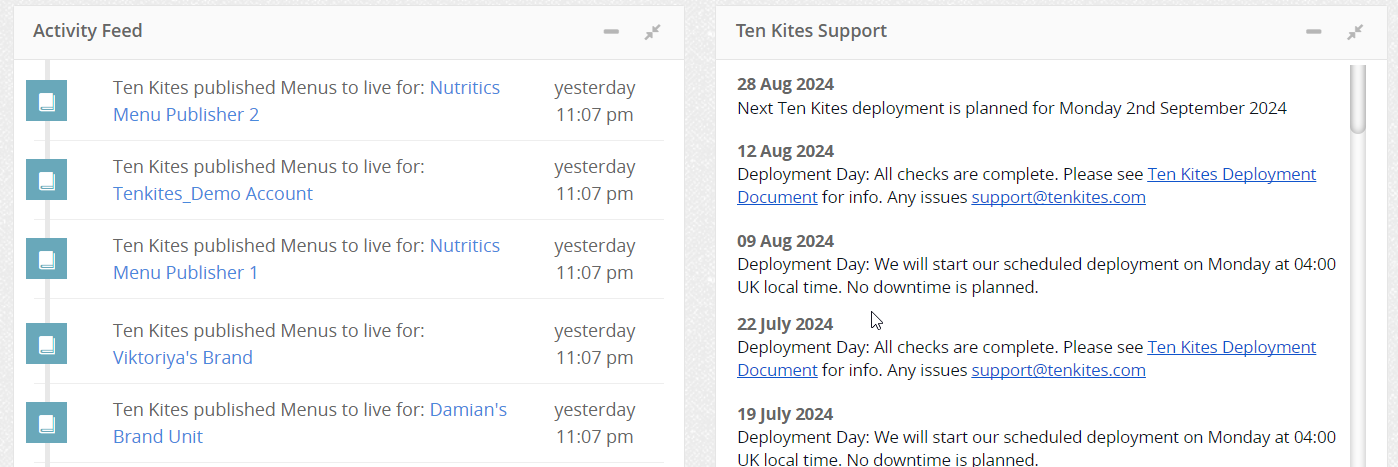
- Activity Feed – View activity in your organisation with time stamps e.g. who published menus, count of items and menus imported.
- Ten Kites Support – View updates on Ten Kites deployment schedule and access to deployment documentation.
- Daily JSON requests for the last 10 days – View request counts for per day for the last 10 days.
- Active Outputs (only available on digital signage analysis) – View active outputs by month and top brands being visited.