The Production and Forecasting tool is designed to optimise your menu planning process. Anticipate menu costs and manage inventory levels by inputting forecasted quantities to effortlessly generate comprehensive cost reports, detailed inventory lists and invaluable waste insights.
Your Nutritics plan will dictate how to access the Production & Forecasting tools shown below.
In this guide we’ll cover:
- Creating Default Forecasting figures for your menus
- Access tracking via a menu
- Access tracking via Forecasting & Waste tab
- Tracking Production & Forecasting
- Exporting Data
CREATE DEFAULT FORECASTING FOR MENUS
Use the ‘Default Forecast’ and ‘Popularity %’ columns on a menu to predict default forecasting figures.
These figures will be saved to your menu and used to compare against daily forecasting.
1. Open a menu and click ‘Choose Columns’
2. Enable the ‘Default Forecast’ and ‘Popularity %’ columns under Administration:
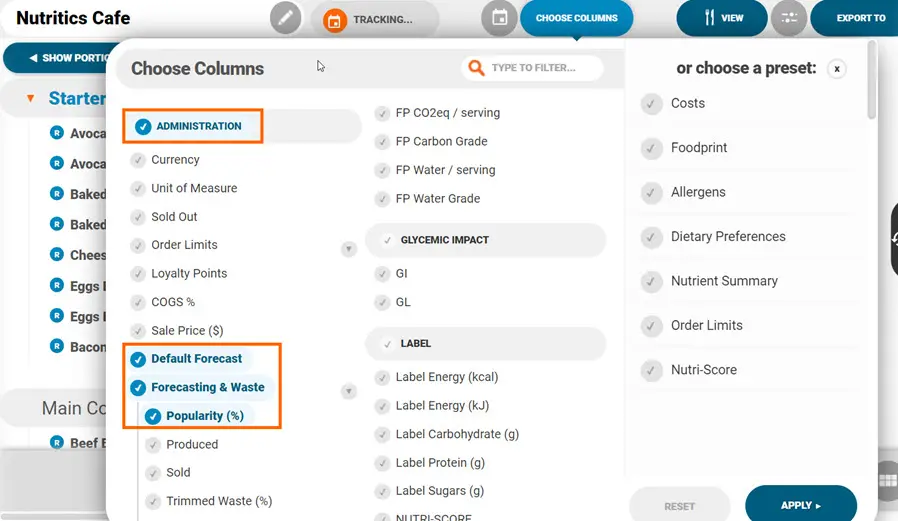
3. Input popularity percentages for the forecast. Nutritics can then estimate the default forecast based on how popular each dish tends to be. For example, when forecasting for 80 covers on this menu, you can input the percentage of how popular each dish tends to be. Nutritics will then use this to estimate the forecasted servings for each dish:
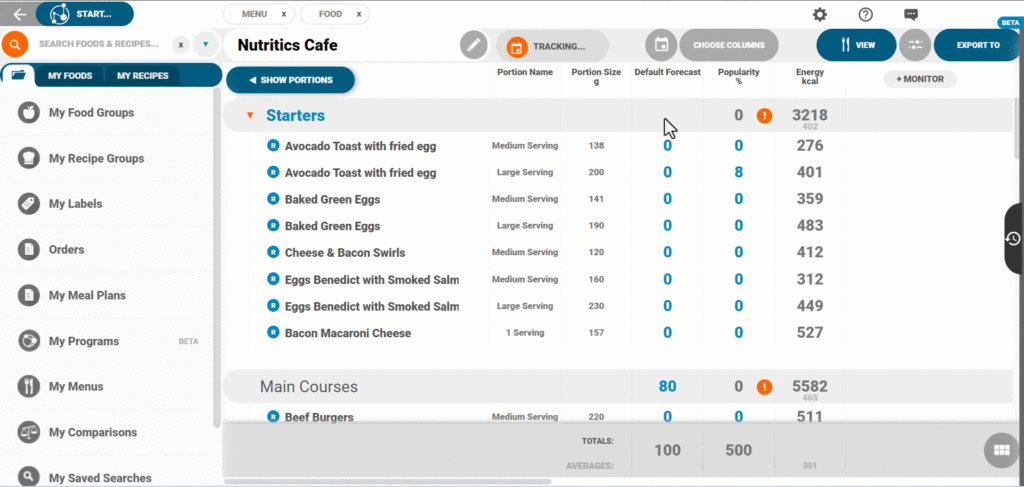
- Input total covers for each heading in the menu
- Input a popularity percentage for each dish under each heading
- You can use the arrow keys on your keyboard to move between the rows
- Repeat this for each group on your menu
These will now be the ‘Default Forecast’ figures for the menu
ANALYSE PRODUCTION AND FORECASTING VIA A MENU
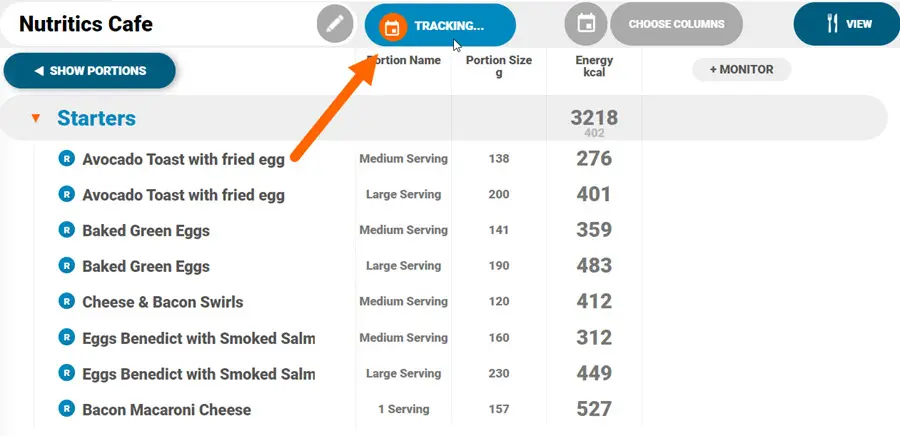
1. Open a menu and click ‘Tracking’ in the top bar:
2. Here you can see the default forecast just analysed for the menu:
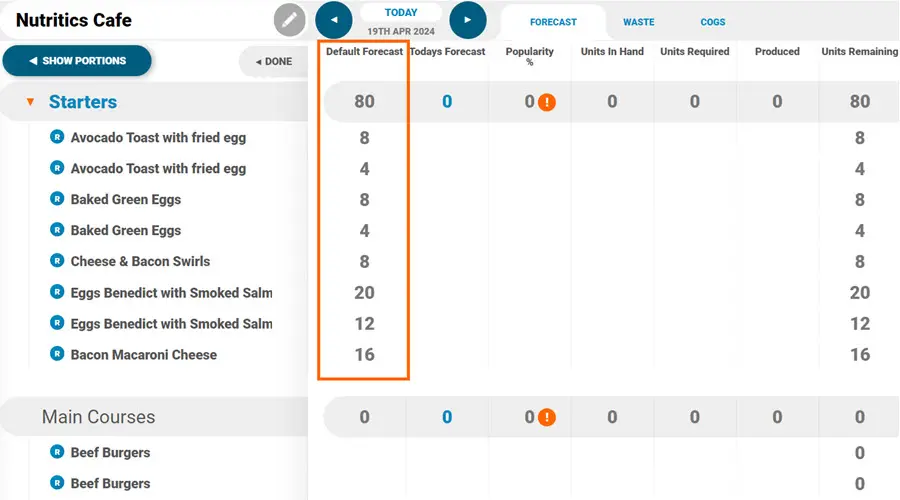
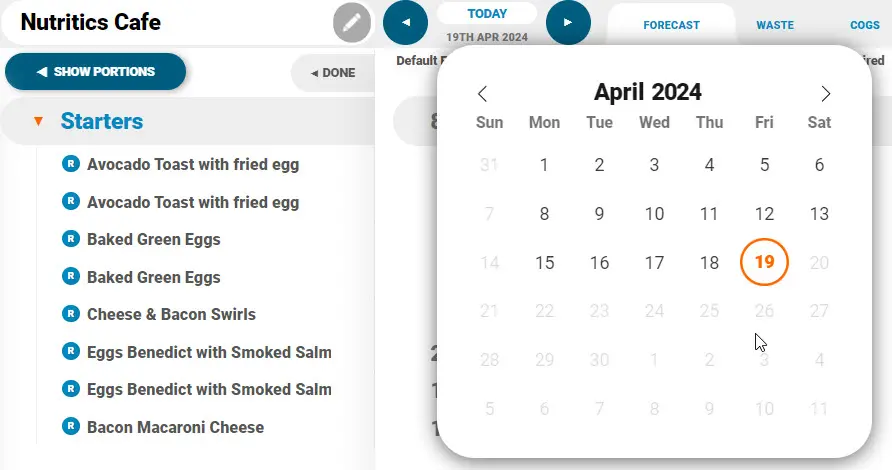
3. You can now analyse the actual forecast for a date selected. Click the date field and select a date to begin analysing. Please note: The dates presented here will be dependent on when the menu was scheduled to be published e.g. this menu is not live on Sundays, therefore, Sundays are greyed out and not an option for analysis:
ANALYSE PRODUCTION & FORECASTING VIA FORECASTING & WASTE TAB
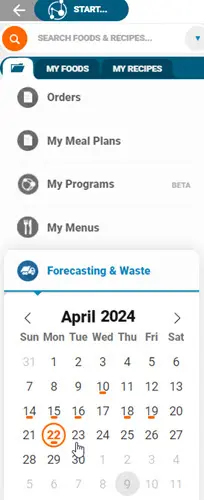
Click ‘Forecasting & Waste’ from the Nutritics Content Explorer and click a date to start tracking:
Load any menu here to begin tracking by clicking the ‘LIVE NOW’ button in the top toolbar:
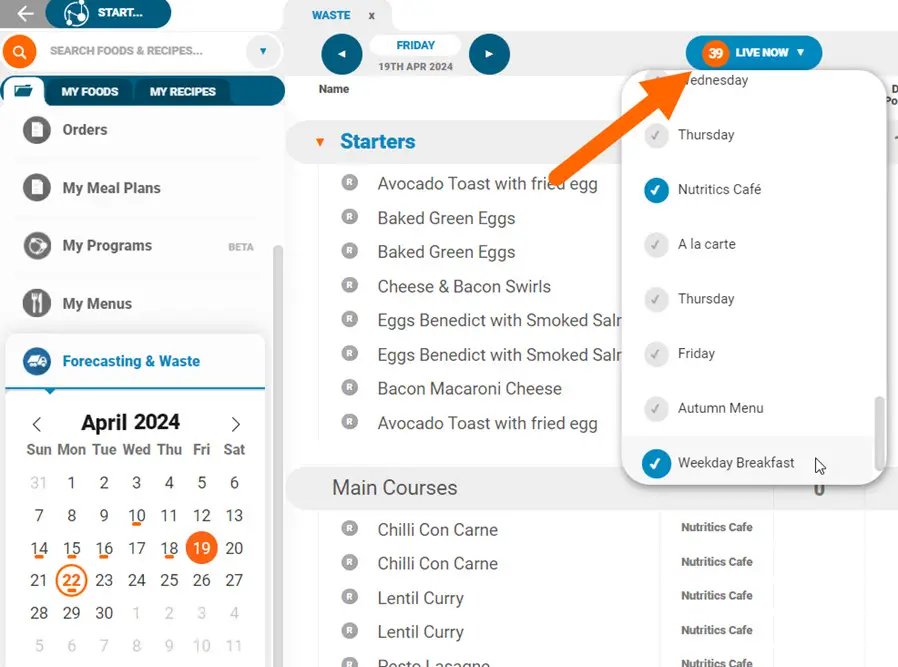
The menus presented here will be dependent on what menus were live on the date selected. Tick the menus you wish to analyse and select ‘Import’ at the bottom of the list. All menu groups and items will add to the workspace.
TRACKING PRODUCTION & FORECASTING
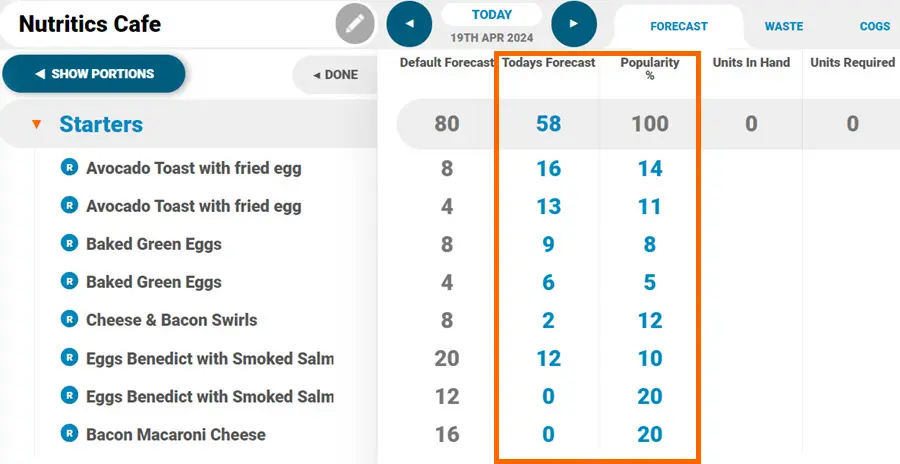
- Input the forecast for the date selected and manually input servings sold for each dish. Alternatively, you can input popularity percentages again to inform the forecast for each dish:
2. Next, input how many units were in hand before service. This may be leftover servings from the day prior, or servings that have already been prepped:
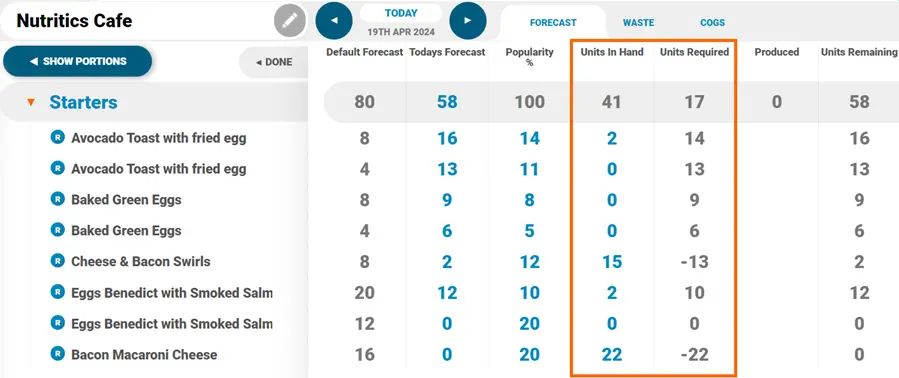
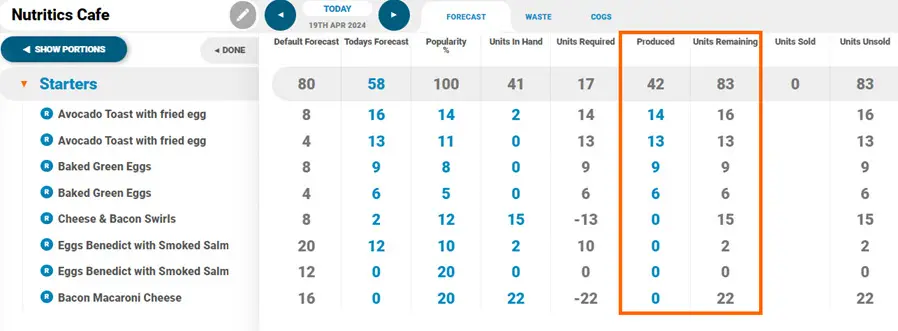
3. This will automatically calculate how many units are required to be produced to cover today’s forecast. You can then input how many servings had to be ‘produced’ on the day to serve all covers
4. The Units Remaining will be calculated to give you an overview of how many servings were available before or during service:
5. Finally, input ‘Units Sold’ to calculate how many servings were sold to customers throughout the day, generating a final figure of ‘Units Unsold’ or waste leftover for this menu. The Units Sold should be similar to the ‘Today’s Forecast’ column. If you are using our ordering system, all orders for this menu will sync across to the units required column automatically.
EXPORTING DATA
If you have our Insights tool you can report the data in easy to view charts. Alternatively, click ‘Export to’ in the top right corner to export the data:
- Report: Preview the data in a new tab. Further share this report via printing (1), downloading as a PDF (2) or using the share link (3):

- Share: Share via a live link. You can also share this link directly to a person’s email address under the Email tab. Download a QR code under the QR tab or view the Embed link under the Embed tab
- Print: Print a snapshot of the list and selected elements directly from Nutritics
- PDF: Download a PDF of the menu report
- Excel: Download the data into Excel
Produce an Inventory List to export food quantities needed to fulfil the forecasted amounts on this menu. This will open our inventory list panel. You can also export to a Production sheet that will scale the exact quantities needed per recipe, including cooking instructions.
Next, move on to the waste tracking columns.